
-
- Height:
- 5-5
-
- Hometown:
- Ballwin, Mo.
-
- Position:
- G
-
- Year:
- Sr.
-
- High School:
- St. Joseph Academy
-
- Major:
- Sports Management
-
- College Accolades:
- See bio below
-
- gp
- 26
-
- pts/g
- 8.8
-
- fg %
- 38.9
-
- 3pt %
- 35.7
-
- ft %
- 87.2
-
- reb/g
- 4.2
-
- a/g
- 7.3
Bio
2016-17 Accolades
SLIAC Co-Player of the Year
1st Team All-SLIAC
SLIAC All-Defensive Team
2016-17 Records
Owns Fontbonne & SLIAC career assist records: 572 assists
2nd all-time in Fontbonne career steals: 300 steals
broke own single-game assist record: 14 at Westminster 11-30-16
single-season assist record: 191 (now owns top three marks in the program)
70 steals in a season ties for 5th all-time (has three of top 5 marks)
87.2% free-throw average is third all-time in a season (41-47 attempts)
1st in Central Region in both total assists and assists per game
2nd nationally with 7.3 assists per game
3rd nationally with 191 assists
2015-16
Fontbonne's Mary Schoendienst Award (top female performer)
Fontbonne team MVP
2nd Team All-SLIAC
SLIAC All-Defensive Team
#1 in Central Region in assists & assists/game
#2 in Central Region in steals & steals/game
6th nationally in steals/game
8th nationally in assists/game
tied record for most assists in a game (12)
set new record for steals in a game (9)
145 assists in a season is #2 all-time
96 steals in a season is #2 all-time
2014-15
3rd Team All-SLIAC
Fontbonne team MVP
single season assist record holder with 149 assists on the year
7th nationally with 6.0 assists/game
Recent games
Season Statistics
| Overall | Conference | |
|---|---|---|
| Games | 26 | 16 |
| Games started | 26 | 16 |
| Minutes | 880 | 586 |
| Minutes per game | 33.8 | 36.6 |
| FG | 77-198 | 48-115 |
| FG Pct | 38.9 | 41.7 |
| 3PT | 35-98 | 20-55 |
| 3PT Pct | 35.7 | 36.4 |
| FT | 41-47 | 29-32 |
| FT Pct | 87.2 | 90.6 |
| Off rebounds | 12 | 5 |
| Def rebounds | 98 | 68 |
| Total rebounds | 110 | 73 |
| Rebounds per game | 4.2 | 4.6 |
| Personal fouls | 64 | 41 |
| Disqualifications | 1 | 1 |
| Assists | 191 | 131 |
| Turnovers | 103 | 64 |
| Assist to turnover ratio | 1.9 | 2.0 |
| Steals | 70 | 47 |
| Blocks | 10 | 6 |
| Points | 230 | 145 |
| Points per game | 8.8 | 9.1 |
| Points per 40 min | 10.5 | 9.9 |
Game Log - Shooting
| Date | Opponent | Score | gs | min | fg | pct | 3pt | pct | ft | pct | pts |
|---|---|---|---|---|---|---|---|---|---|---|---|
| Nov 17 | at Dallas Christian | W, 75-66 | 1 | 24 | 3-10 | 30.0 | 0-1 | 0.0 | 3-3 | 100.0 | 9 |
| Nov 18 | at Dallas | L, 60-50 | 1 | 30 | 3-7 | 42.9 | 1-2 | 50.0 | 0-0 | - | 7 |
| Nov 22 | Harris-Stowe | L, 84-35 | 1 | 15 | 1-6 | 16.7 | 1-4 | 25.0 | 0-0 | - | 3 |
| Nov 26 | Central (Iowa) | L, 55-52 | 1 | 29 | 0-3 | 0.0 | 0-3 | 0.0 | 0-0 | - | 0 |
| Nov 30 | at Westminster (Mo.) | L, 79-68 | 1 | 36 | 3-7 | 42.9 | 1-2 | 50.0 | 0-0 | - | 7 |
| Dec 3 | MacMurray | W, 80-36 | 1 | 23 | 2-3 | 66.7 | 0-1 | 0.0 | 1-2 | 50.0 | 5 |
| Dec 6 | at Washington (Mo.) | L, 94-47 | 1 | 23 | 3-5 | 60.0 | 1-2 | 50.0 | 1-2 | 50.0 | 8 |
| Dec 10 | Blackburn | W, 75-50 | 1 | 37 | 4-7 | 57.1 | 2-3 | 66.7 | 2-2 | 100.0 | 12 |
| Dec 13 | Robert Morris-S'fiel | W, 93-33 | 1 | 35 | 7-12 | 58.3 | 4-7 | 57.1 | 4-4 | 100.0 | 22 |
| Dec 17 | at Greenville | L, 77-59 | 1 | 40 | 1-6 | 16.7 | 0-4 | 0.0 | 0-2 | 0.0 | 2 |
| Dec 30 | at Warner | L, 54-47 | 1 | 36 | 2-9 | 22.2 | 1-6 | 16.7 | 1-2 | 50.0 | 6 |
| Dec 31 | at Webber Int'l | W, 70-60 | 1 | 33 | 3-10 | 30.0 | 1-4 | 25.0 | 0-0 | - | 7 |
| Jan 4 | at Eureka | L, 61-57 | 1 | 39 | 2-9 | 22.2 | 0-2 | 0.0 | 3-3 | 100.0 | 7 |
| Jan 7 | Robert Morris- Peoria | W, 73-46 | 1 | 29 | 3-8 | 37.5 | 3-6 | 50.0 | 1-2 | 50.0 | 10 |
| Jan 11 | at Spalding | W, 57-51 | 1 | 34 | 4-6 | 66.7 | 2-3 | 66.7 | 2-2 | 100.0 | 12 |
| Jan 16 | Iowa Wesleyan | L, 71-50 | 1 | 40 | 1-3 | 33.3 | 0-1 | 0.0 | 0-0 | - | 2 |
| Jan 18 | Webster | W, 56-52 | 1 | 32 | 2-3 | 66.7 | 1-2 | 50.0 | 2-2 | 100.0 | 7 |
| Jan 21 | Westminster (Mo.) | L, 54-50 | 1 | 40 | 4-9 | 44.4 | 3-6 | 50.0 | 0-0 | - | 11 |
| Jan 25 | at MacMurray | W, 81-58 | 1 | 37 | 3-9 | 33.3 | 1-3 | 33.3 | 8-8 | 100.0 | 15 |
| Jan 28 | at Blackburn | W, 79-39 | 1 | 39 | 9-15 | 60.0 | 4-9 | 44.4 | 1-1 | 100.0 | 23 |
| Feb 1 | Greenville | W, 68-38 | 1 | 37 | 7-13 | 53.8 | 3-7 | 42.9 | 2-2 | 100.0 | 19 |
| Feb 4 | Eureka | W, 67-62 | 1 | 38 | 4-11 | 36.4 | 2-4 | 50.0 | 2-2 | 100.0 | 12 |
| Feb 11 | Spalding | W, 76-71 | 1 | 40 | 0-3 | 0.0 | 0-2 | 0.0 | 2-2 | 100.0 | 2 |
| Feb 15 | at Iowa Wesleyan | L, 48-44 | 1 | 34 | 1-8 | 12.5 | 1-5 | 20.0 | 0-0 | - | 3 |
| Feb 18 | at Webster | L, 83-58 | 1 | 40 | 1-3 | 33.3 | 0-1 | 0.0 | 4-4 | 100.0 | 6 |
| Feb 23 | at Eureka | L, 86-55 | 1 | 40 | 4-13 | 30.8 | 3-8 | 37.5 | 2-2 | 100.0 | 13 |
Game Log - Ball control
| Date | Opponent | Score | gs | min | off | def | reb | ast | to | stl | blk |
|---|---|---|---|---|---|---|---|---|---|---|---|
| Nov 17 | at Dallas Christian | W, 75-66 | 1 | 24 | 1 | 2 | 3 | 4 | 2 | 2 | 0 |
| Nov 18 | at Dallas | L, 60-50 | 1 | 30 | 1 | 3 | 4 | 4 | 8 | 2 | 0 |
| Nov 22 | Harris-Stowe | L, 84-35 | 1 | 15 | 0 | 1 | 1 | 2 | 3 | 0 | 1 |
| Nov 26 | Central (Iowa) | L, 55-52 | 1 | 29 | 0 | 2 | 2 | 5 | 3 | 0 | 1 |
| Nov 30 | at Westminster (Mo.) | L, 79-68 | 1 | 36 | 0 | 3 | 3 | 14 | 1 | 1 | 0 |
| Dec 3 | MacMurray | W, 80-36 | 1 | 23 | 0 | 3 | 3 | 9 | 3 | 2 | 0 |
| Dec 6 | at Washington (Mo.) | L, 94-47 | 1 | 23 | 0 | 2 | 2 | 3 | 8 | 0 | 0 |
| Dec 10 | Blackburn | W, 75-50 | 1 | 37 | 0 | 8 | 8 | 8 | 6 | 2 | 0 |
| Dec 13 | Robert Morris-S'fiel | W, 93-33 | 1 | 35 | 1 | 3 | 4 | 8 | 3 | 6 | 0 |
| Dec 17 | at Greenville | L, 77-59 | 1 | 40 | 1 | 3 | 4 | 6 | 2 | 1 | 2 |
| Dec 30 | at Warner | L, 54-47 | 1 | 36 | 0 | 3 | 3 | 10 | 3 | 3 | 1 |
| Dec 31 | at Webber Int'l | W, 70-60 | 1 | 33 | 2 | 6 | 8 | 12 | 2 | 5 | 0 |
| Jan 4 | at Eureka | L, 61-57 | 1 | 39 | 1 | 5 | 6 | 8 | 4 | 1 | 0 |
| Jan 7 | Robert Morris- Peoria | W, 73-46 | 1 | 29 | 0 | 5 | 5 | 11 | 4 | 1 | 0 |
| Jan 11 | at Spalding | W, 57-51 | 1 | 34 | 0 | 4 | 4 | 9 | 6 | 5 | 1 |
| Jan 16 | Iowa Wesleyan | L, 71-50 | 1 | 40 | 0 | 3 | 3 | 9 | 4 | 7 | 0 |
| Jan 18 | Webster | W, 56-52 | 1 | 32 | 0 | 2 | 2 | 9 | 6 | 3 | 0 |
| Jan 21 | Westminster (Mo.) | L, 54-50 | 1 | 40 | 0 | 2 | 2 | 7 | 4 | 4 | 0 |
| Jan 25 | at MacMurray | W, 81-58 | 1 | 37 | 0 | 3 | 3 | 11 | 3 | 4 | 1 |
| Jan 28 | at Blackburn | W, 79-39 | 1 | 39 | 0 | 4 | 4 | 10 | 4 | 7 | 0 |
| Feb 1 | Greenville | W, 68-38 | 1 | 37 | 1 | 7 | 8 | 6 | 4 | 2 | 0 |
| Feb 4 | Eureka | W, 67-62 | 1 | 38 | 0 | 5 | 5 | 6 | 5 | 3 | 0 |
| Feb 11 | Spalding | W, 76-71 | 1 | 40 | 0 | 7 | 7 | 10 | 3 | 0 | 0 |
| Feb 15 | at Iowa Wesleyan | L, 48-44 | 1 | 34 | 1 | 5 | 6 | 2 | 5 | 0 | 0 |
| Feb 18 | at Webster | L, 83-58 | 1 | 40 | 1 | 4 | 5 | 7 | 4 | 5 | 2 |
| Feb 23 | at Eureka | L, 86-55 | 1 | 40 | 2 | 3 | 5 | 1 | 3 | 4 | 1 |
Game Log - Ball control extended
| Date | Opponent | Score | gs | pf | dq | a/to |
|---|---|---|---|---|---|---|
| Nov 17 | at Dallas Christian | W, 75-66 | 1 | 4 | - | 2.0 |
| Nov 18 | at Dallas | L, 60-50 | 1 | 4 | - | 0.5 |
| Nov 22 | Harris-Stowe | L, 84-35 | 1 | 2 | - | 0.7 |
| Nov 26 | Central (Iowa) | L, 55-52 | 1 | 0 | 0 | 1.7 |
| Nov 30 | at Westminster (Mo.) | L, 79-68 | 1 | 4 | - | 14.0 |
| Dec 3 | MacMurray | W, 80-36 | 1 | 1 | - | 3.0 |
| Dec 6 | at Washington (Mo.) | L, 94-47 | 1 | 1 | - | 0.4 |
| Dec 10 | Blackburn | W, 75-50 | 1 | 3 | 0 | 1.3 |
| Dec 13 | Robert Morris-S'fiel | W, 93-33 | 1 | 2 | 0 | 2.7 |
| Dec 17 | at Greenville | L, 77-59 | 1 | 1 | - | 3.0 |
| Dec 30 | at Warner | L, 54-47 | 1 | 4 | - | 3.3 |
| Dec 31 | at Webber Int'l | W, 70-60 | 1 | 1 | - | 6.0 |
| Jan 4 | at Eureka | L, 61-57 | 1 | 3 | 0 | 2.0 |
| Jan 7 | Robert Morris- Peoria | W, 73-46 | 1 | 4 | - | 2.8 |
| Jan 11 | at Spalding | W, 57-51 | 1 | 1 | - | 1.5 |
| Jan 16 | Iowa Wesleyan | L, 71-50 | 1 | 4 | 0 | 2.3 |
| Jan 18 | Webster | W, 56-52 | 1 | 3 | - | 1.5 |
| Jan 21 | Westminster (Mo.) | L, 54-50 | 1 | 5 | 1 | 1.8 |
| Jan 25 | at MacMurray | W, 81-58 | 1 | 2 | - | 3.7 |
| Jan 28 | at Blackburn | W, 79-39 | 1 | 1 | - | 2.5 |
| Feb 1 | Greenville | W, 68-38 | 1 | 3 | 0 | 1.5 |
| Feb 4 | Eureka | W, 67-62 | 1 | 4 | - | 1.2 |
| Feb 11 | Spalding | W, 76-71 | 1 | 0 | - | 3.3 |
| Feb 15 | at Iowa Wesleyan | L, 48-44 | 1 | 4 | - | 0.4 |
| Feb 18 | at Webster | L, 83-58 | 1 | 2 | 0 | 1.8 |
| Feb 23 | at Eureka | L, 86-55 | 1 | 1 | - | 0.3 |
| gp | gs | min | fg | pct | 3pt | pct | ft | pct | pts | |
|---|---|---|---|---|---|---|---|---|---|---|
| 2013-14 | 25 | 22 | 667 | 41-115 | 35.7 | 23-72 | 31.9 | 19-23 | 82.6 | 124 |
| 2014-15 | 25 | 25 | 834 | 82-218 | 37.6 | 20-89 | 22.5 | 35-51 | 68.6 | 219 |
| 2015-16 | 24 | 23 | 753 | 65-192 | 33.9 | 17-66 | 25.8 | 51-66 | 77.3 | 198 |
| 2016-17 | 26 | 26 | 880 | 77-198 | 38.9 | 35-98 | 35.7 | 41-47 | 87.2 | 230 |
| Total | 100 | 96 | 3134 | 265-723 | 36.7 | 95-325 | 29.2 | 146-187 | 78.1 | 771 |
Career Stats: Shooting totals
| gp | min | min/g | fg/40 | 3pt/40 | pct | ft/40 | pts/40 | |
|---|---|---|---|---|---|---|---|---|
| 2013-14 | 25 | 667 | 26.7 | 2.5-6.9 | 1.4-4.3 | 31.9 | 1.1-1.4 | 7.4 |
| 2014-15 | 25 | 834 | 33.4 | 3.9-10.5 | 1.0-4.3 | 22.5 | 1.7-2.4 | 10.5 |
| 2015-16 | 24 | 753 | 31.4 | 3.5-10.2 | 0.9-3.5 | 25.8 | 2.7-3.5 | 10.5 |
| 2016-17 | 26 | 880 | 33.8 | 3.5-9.0 | 1.6-4.5 | 35.7 | 1.9-2.1 | 10.5 |
| Total | 100 | 3134 | 31.3 | 3.4-9.2 | 1.2-4.1 | 29.2 | 1.9-2.4 | 9.8 |
Career Stats: Shooting per 40 min
| gp | min/g | fg/g | 3pt/g | ft/g | ppg | |
|---|---|---|---|---|---|---|
| Event | ||||||
| Total | 26 | 33.8 | 3.0-7.6 | 1.3-3.8 | 1.6-1.8 | 8.8 |
| Conference | 16 | 36.6 | 3.0-7.2 | 1.2-3.4 | 1.8-2.0 | 9.1 |
| Exhibition | - | - | 0.0-0.0 | 0.0-0.0 | 0.0-0.0 | - |
| Location | ||||||
| Home | 12 | 32.9 | 2.9-6.8 | 1.6-3.8 | 1.3-1.5 | 8.8 |
| Away | 14 | 34.6 | 3.0-8.4 | 1.1-3.7 | 1.8-2.1 | 8.9 |
| Neutral | - | - | 0.0-0.0 | 0.0-0.0 | 0.0-0.0 | - |
| Result | ||||||
| Wins | 13 | 33.7 | 3.9-8.5 | 1.8-4.0 | 2.3-2.5 | 11.9 |
| Losses | 13 | 34.0 | 2.0-6.8 | 0.9-3.5 | 0.8-1.2 | 5.8 |
| Month | ||||||
| November | 5 | 26.8 | 2.0-6.6 | 0.6-2.4 | 0.6-0.6 | 5.2 |
| December | 7 | 32.4 | 3.1-7.4 | 1.3-3.9 | 1.3-2.0 | 8.9 |
| January | 8 | 36.3 | 3.5-7.8 | 1.8-4.0 | 2.1-2.2 | 10.9 |
| February | 6 | 38.2 | 2.8-8.5 | 1.5-4.5 | 2.0-2.0 | 9.2 |
Splits Stats: Shooting per game
| gp | gs | min | fg | pct | 3pt | pct | ft | pct | pts | |
|---|---|---|---|---|---|---|---|---|---|---|
| Event | ||||||||||
| Total | 26 | 26 | 880 | 77-198 | 38.9 | 35-98 | 35.7 | 41-47 | 87.2 | 230 |
| Conference | 16 | 16 | 586 | 48-115 | 41.7 | 20-55 | 36.4 | 29-32 | 90.6 | 145 |
| Exhibition | - | - | - | 0-0 | - | 0-0 | - | 0-0 | - | 0 |
| Location | ||||||||||
| Home | 12 | 12 | 395 | 35-81 | 43.2 | 19-46 | 41.3 | 16-18 | 88.9 | 105 |
| Away | 14 | 14 | 485 | 42-117 | 35.9 | 16-52 | 30.8 | 25-29 | 86.2 | 125 |
| Neutral | - | - | - | 0-0 | - | 0-0 | - | 0-0 | - | 0 |
| Result | ||||||||||
| Wins | 13 | 13 | 438 | 51-110 | 46.4 | 23-52 | 44.2 | 30-32 | 93.8 | 155 |
| Losses | 13 | 13 | 442 | 26-88 | 29.5 | 12-46 | 26.1 | 11-15 | 73.3 | 75 |
| Month | ||||||||||
| November | 5 | 5 | 134 | 10-33 | 30.3 | 3-12 | 25.0 | 3-3 | 100.0 | 26 |
| December | 7 | 7 | 227 | 22-52 | 42.3 | 9-27 | 33.3 | 9-14 | 64.3 | 62 |
| January | 8 | 8 | 290 | 28-62 | 45.2 | 14-32 | 43.8 | 17-18 | 94.4 | 87 |
| February | 6 | 6 | 229 | 17-51 | 33.3 | 9-27 | 33.3 | 12-12 | 100.0 | 55 |
Splits Stats: Shooting totals
| gp | min | min/g | fg/40 | 3pt/40 | pct | ft/40 | pts/40 | |
|---|---|---|---|---|---|---|---|---|
| Event | ||||||||
| Total | 26 | 880 | 33.8 | 3.5-9.0 | 1.6-4.5 | 35.7 | 1.9-2.1 | 10.5 |
| Conference | 16 | 586 | 36.6 | 3.3-7.8 | 1.4-3.8 | 36.4 | 2.0-2.2 | 9.9 |
| Exhibition | - | - | - | 0.0-0.0 | 0.0-0.0 | - | 0.0-0.0 | - |
| Location | ||||||||
| Home | 12 | 395 | 32.9 | 3.5-8.2 | 1.9-4.7 | 41.3 | 1.6-1.8 | 10.6 |
| Away | 14 | 485 | 34.6 | 3.5-9.6 | 1.3-4.3 | 30.8 | 2.1-2.4 | 10.3 |
| Neutral | - | - | - | 0.0-0.0 | 0.0-0.0 | - | 0.0-0.0 | - |
| Result | ||||||||
| Wins | 13 | 438 | 33.7 | 4.7-10.0 | 2.1-4.7 | 44.2 | 2.7-2.9 | 14.2 |
| Losses | 13 | 442 | 34.0 | 2.4-8.0 | 1.1-4.2 | 26.1 | 1.0-1.4 | 6.8 |
| Month | ||||||||
| November | 5 | 134 | 26.8 | 3.0-9.9 | 0.9-3.6 | 25.0 | 0.9-0.9 | 7.8 |
| December | 7 | 227 | 32.4 | 3.9-9.2 | 1.6-4.8 | 33.3 | 1.6-2.5 | 10.9 |
| January | 8 | 290 | 36.3 | 3.9-8.6 | 1.9-4.4 | 43.8 | 2.3-2.5 | 12.0 |
| February | 6 | 229 | 38.2 | 3.0-8.9 | 1.6-4.7 | 33.3 | 2.1-2.1 | 9.6 |
Splits Stats: Shooting per 40 min
| gp | off/g | def/g | reb/g | ast/g | to/g | stl/g | blk/g | |
|---|---|---|---|---|---|---|---|---|
| Event | ||||||||
| Total | 26 | 0.5 | 3.8 | 4.2 | 7.3 | 4.0 | 2.7 | 0.4 |
| Conference | 16 | 0.3 | 4.3 | 4.6 | 8.2 | 4.0 | 2.9 | 0.4 |
| Exhibition | - | - | - | - | - | - | - | - |
| Location | ||||||||
| Home | 12 | 0.2 | 4.0 | 4.2 | 7.5 | 4.0 | 2.5 | 0.2 |
| Away | 14 | 0.7 | 3.6 | 4.3 | 7.2 | 3.9 | 2.9 | 0.6 |
| Neutral | - | - | - | - | - | - | - | - |
| Result | ||||||||
| Wins | 13 | 0.4 | 4.5 | 4.9 | 8.7 | 3.9 | 3.2 | 0.2 |
| Losses | 13 | 0.5 | 3.0 | 3.5 | 6.0 | 4.0 | 2.2 | 0.6 |
| Month | ||||||||
| November | 5 | 0.4 | 2.2 | 2.6 | 5.8 | 3.4 | 1.0 | 0.4 |
| December | 7 | 0.6 | 4.0 | 4.6 | 8.0 | 3.9 | 2.7 | 0.4 |
| January | 8 | 0.1 | 3.5 | 3.6 | 9.3 | 4.4 | 4.0 | 0.3 |
| February | 6 | 0.8 | 5.2 | 6.0 | 5.3 | 4.0 | 2.3 | 0.5 |
Splits Stats: Ball control per game
| gp | gs | off | def | reb | ast | to | stl | blk | |
|---|---|---|---|---|---|---|---|---|---|
| Event | |||||||||
| Total | 26 | 26 | 12 | 98 | 110 | 191 | 103 | 70 | 10 |
| Conference | 16 | 16 | 5 | 68 | 73 | 131 | 64 | 47 | 6 |
| Exhibition | - | - | - | - | - | - | - | - | - |
| Location | |||||||||
| Home | 12 | 12 | 2 | 48 | 50 | 90 | 48 | 30 | 2 |
| Away | 14 | 14 | 10 | 50 | 60 | 101 | 55 | 40 | 8 |
| Neutral | - | - | - | - | - | - | - | - | - |
| Result | |||||||||
| Wins | 13 | 13 | 5 | 59 | 64 | 113 | 51 | 42 | 2 |
| Losses | 13 | 13 | 7 | 39 | 46 | 78 | 52 | 28 | 8 |
| Month | |||||||||
| November | 5 | 5 | 2 | 11 | 13 | 29 | 17 | 5 | 2 |
| December | 7 | 7 | 4 | 28 | 32 | 56 | 27 | 19 | 3 |
| January | 8 | 8 | 1 | 28 | 29 | 74 | 35 | 32 | 2 |
| February | 6 | 6 | 5 | 31 | 36 | 32 | 24 | 14 | 3 |
Splits Stats: Ball control totals
| gp | off/40 | def/40 | reb/40 | ast/40 | to/40 | stl/40 | blk/40 | |
|---|---|---|---|---|---|---|---|---|
| Event | ||||||||
| Total | 26 | 0.5 | 4.5 | 5.0 | 8.7 | 4.7 | 3.2 | 0.5 |
| Conference | 16 | 0.3 | 4.6 | 5.0 | 8.9 | 4.4 | 3.2 | 0.4 |
| Exhibition | - | - | - | - | - | - | - | - |
| Location | ||||||||
| Home | 12 | 0.2 | 4.9 | 5.1 | 9.1 | 4.9 | 3.0 | 0.2 |
| Away | 14 | 0.8 | 4.1 | 4.9 | 8.3 | 4.5 | 3.3 | 0.7 |
| Neutral | - | - | - | - | - | - | - | - |
| Result | ||||||||
| Wins | 13 | 0.5 | 5.4 | 5.8 | 10.3 | 4.7 | 3.8 | 0.2 |
| Losses | 13 | 0.6 | 3.5 | 4.2 | 7.1 | 4.7 | 2.5 | 0.7 |
| Month | ||||||||
| November | 5 | 0.6 | 3.3 | 3.9 | 8.7 | 5.1 | 1.5 | 0.6 |
| December | 7 | 0.7 | 4.9 | 5.6 | 9.9 | 4.8 | 3.3 | 0.5 |
| January | 8 | 0.1 | 3.9 | 4.0 | 10.2 | 4.8 | 4.4 | 0.3 |
| February | 6 | 0.9 | 5.4 | 6.3 | 5.6 | 4.2 | 2.4 | 0.5 |
Splits Stats: Ball control per 40 min
News mentions
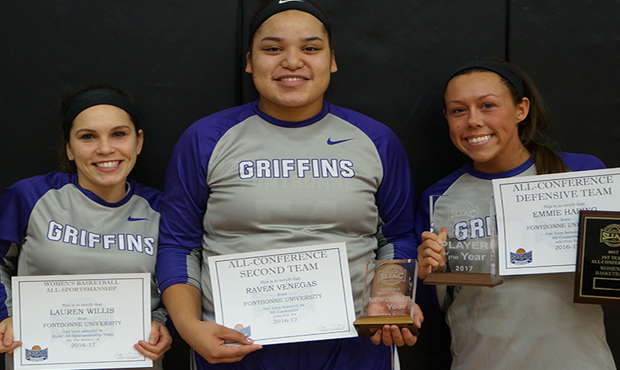
Emmie Haring was named SLIAC Co-Player of the Year while Raven Venegas was named Newcomer of the Year. Lauren Willis represented the Griffins on the All-Sportsmanship Team.
Fontbonne women's basketball fell to first-seeded Eureka College in the opening round of the SLIAC Tournament. The Griffins finish 13-13 overall as they lose Haring and Willis to graduation.

Fontbonne women's basketball, the fourth seed, will take on hosts Eureka College on Thursday at 8 p.m in the SLIAC Semifinals.
The loss at Webster ends Fontbonne's regular season and puts them as the fourth seed in the SLIAC Tournament next week.

The Fontbonne University women’s basketball team clinched a spot in the SLIAC Tournament for the first time since 2012 by beating Spalding University today 76-71.

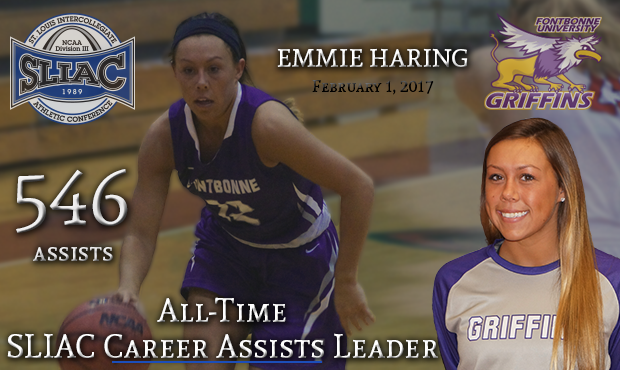
Fontbonne University women's basketball senior Emmie Haring is the newest owner of the St. Louis Intercollegiate Athletic Conference career assist record. She broke the 541 assist mark set in 1994 on this play as the Griffins defeated Greenville 68-38.
The Griffins broke open with a 23-4 first-quarter lead before defeating the Panthers 68-38. Haring recorded yet another career record, this time on the conference level while she and two others reached double digits. Venegas tallied a career-high 20 points, going 10-13.
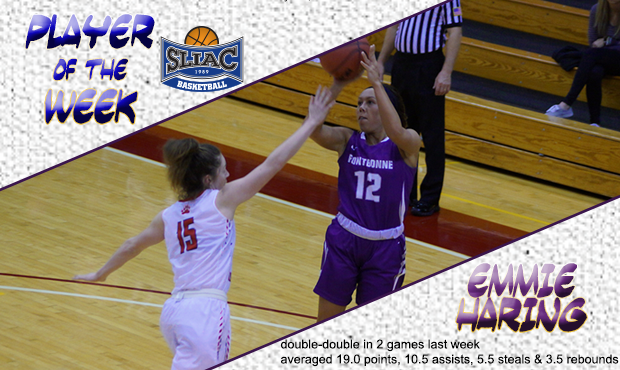
Senior point guard Emmie Haring has been named St. Louis Intercollegiate Athletic Conference Player of the Week after recording a double-double in each game last week.
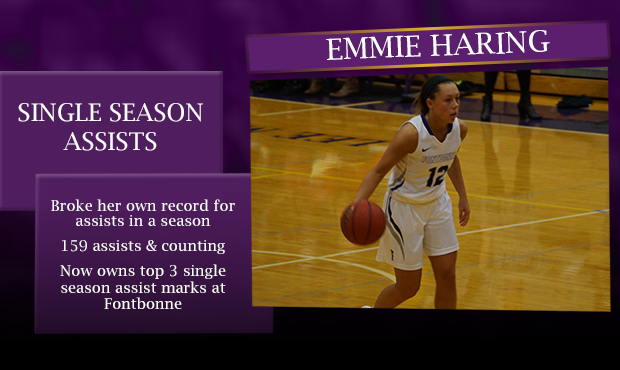
Haring records double-double as she breaks her own single season assist record. Willis scored career-high 16 points as Walker nets 10 in 40-point victory.

Sophomore Kaitlynn Walker scored a career-high 26 points while Emmie Haring recorded a double-double with 15 points and 11 assists. Walker also tallied seven rebounds and three steals as Sarah Schraut went 5-of-9 and 12 points. Haring tied her own school-record for single-season assists (149).

Women's basketball defeated Webster 56-52.

The NCAA Division III leader in total assists and assists per game has 122 assists on the year and averages 7.6 per game.

Senior Emmie Haring's accolades continue. The point-guard has 85 assists on the year and as of January 3, leads NCAA Division III in total assists.

